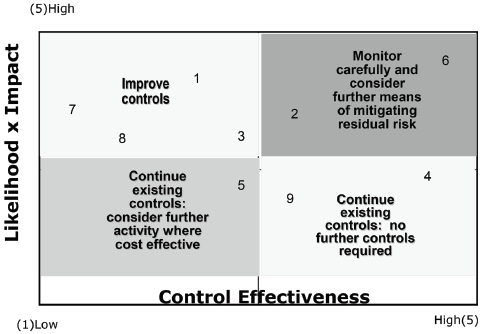
The combined likelihood and impact score is charted on the y-axis against the control effectiveness score on the x-axis. This document is only available to subscribers. Please log in or purchase access. Purchase Login